M101-6: Major Model Elements
15m Read
From Parts to Purpose
Every financial model—whether built for a city budget office, a regional water authority, or a university business office—relies on the same foundational elements. These components turn scattered data and assumptions into a coherent decision-support system.
In the public sector, models often grow organically: one spreadsheet becomes ten, new tabs are copied from old versions, and key formulas evolve with each budget cycle. The result is a tool that works, but only until it doesn’t. By understanding the core elements of modern modeling, leaders can transform these piecemeal efforts into transparent, durable frameworks that strengthen foresight and accountability.
Section 1
The Engine: Powering the Model
The engine is the core machinery of any financial model—the system that converts raw data and assumptions into forward-looking forecasts. It defines how a model behaves and why results change over time.
Business Objects: The Building Blocks of a Model
Every model begins with business objects—the core financial elements that represent how an institution or utility actually operates. Rather than modeling entire departments or divisions, business objects mirror the financial components that drive activity, cost, and revenue.
These objects serve as the model’s “moving parts,” capturing distinct financial behaviors that, when combined, recreate the full economic picture of the organization.
Examples of business objects include:
- Student types (e.g., first-year, continuing, graduate)
- Ratepayer categories (e.g., residential, commercial, industrial)
- Employee groups (e.g., faculty, staff, operators)
- Investments
- Debt instruments
- Capital projects
Each business object is a financial element at the right level of granularity—specific enough to behave accurately, but general enough to support efficient modeling and scenario analysis.
- In spreadsheets, business objects often appear as separate tabs or reports, copied from past versions and prone to drifting out of sync.
- In structured models, they are defined once, then reused wherever relevant—ensuring every department or initiative follows consistent logic.
A municipal utility’s model might include business objects for Rate Revenue, Capital Projects, Debt Service, and Operating Expenses. Each interacts to show how policy or cost changes flow through the broader financial picture.
Parameters: How Business Objects Behave
Each business object is governed by parameters—the data, assumptions, and formulas that describe its behavior. Parameters answer questions like: What drives this cost? What causes this revenue to grow?
Typical parameter types include:
DATA
Historical actuals that anchor the model in reality.
ASSUMPTIONS
Controllable inputs that represent leadership decisions (e.g., rate increases, enrollment targets).
FORMULAS
Rules linking assumptions to results, creating the model’s behavioral logic.
Parameters can interact:
LOCALLY
Within a single business object (e.g., Units × Rate = Revenue)
ACROSS OBJECTS
Showing dependencies (e.g., Tuition Revenue impacts Financial Aid Expense)
Common Parameter Types
Here is where the concrete math belongs — describing exactly how finance teams think about these elements in spreadsheets and structured models.
This interplay is what makes the model an engine, not just a ledger.
|
STUDENT TYPES
|
RATEPAYER GROUPS (UTILITIES)
Formula: |
EMPLOYEE GROUPS
Formula: |
|
DEBT INSTRUMENTS
Formula: Principal Amortization follows the debt schedule or the amortization method applied. |
INVESTMENTS
Formula: |
CAPITAL PROJECTS
Formula: |
Relationships and System Behavior
Models gain depth when parameters influence one another through clear, intentional relationships. These interactions allow the model to simulate real-world behavior rather than simply calculate isolated values. For instance, when a city or district invests in new infrastructure, the model must reflect not only the upfront cost but the downstream effects—additional depreciation, future debt service, and ongoing maintenance obligations.
These relationships help modelers trace cause and effect across the entire financial system. In public-sector forecasting, even small changes—such as a 1% rate adjustment or a slight shift in demand—can echo across multiple funds, programs, or departments. Understanding these interdependencies is essential: it ensures that model behavior reflects institutional reality and gives decision-makers a clear view of how individual choices shape long-term outcomes.
Time-Series Forecasting: Turning Logic into Trajectory
The engine’s value emerges when its components operate over time.
A time series forecast links the past to the future:
- Historical Data records what actually happened.
- Assumptions adjust parameters to reflect expected change.
- Formulas project results year by year.
- Outputs appear as evolving line items—revenues, expenses, balances—that reveal financial trajectory.
A state agency evaluating a new funding formula can model how annual appropriation shifts flow through multi-year commitments, revealing timing pressures that aren’t visible in a single-year view.
Defining the Modeling Engine
When business objects, parameters, relationships, and time-series behavior work in concert, they form the modeling engine—a self-contained system capable of simulating how strategic decisions unfold over time. The strength of this engine lies in its structure.

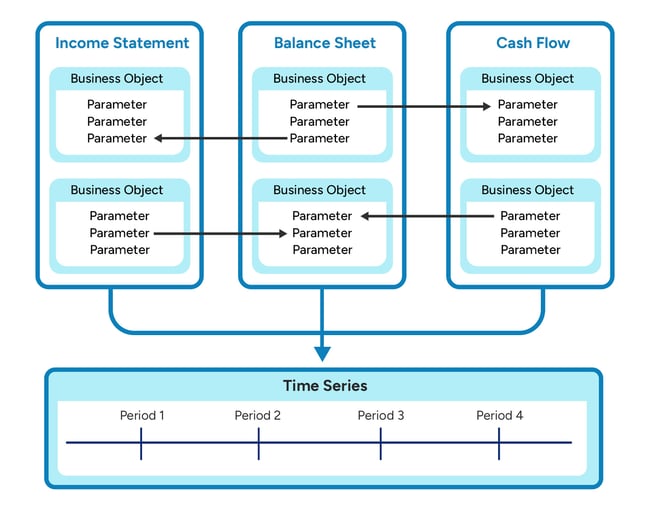
A well-designed model is modular, allowing components to evolve as policies, programs, or market conditions change. It is transparent, enabling auditors, analysts, and stakeholders to trace outcomes back to the assumptions and logic that produced them. And it is consistent, maintaining its integrity across fiscal cycles and leadership transitions without requiring constant reinvention.
Ultimately, the engine transforms isolated data points into a coherent forecasting framework. It ensures that every assumption leads logically to an outcome, and every outcome remains traceable to its source. In the public sector—where long-term obligations, community expectations, and regulatory pressures intersect—this coherence turns a model from a static spreadsheet into a living decision framework that supports strategic clarity and institutional confidence.
Section 2
Analysis: Turning Data into Decisions
Once the engine is in place, analysis transforms it from a static forecasting tool into a dynamic environment for exploring alternative futures. Analysis is where assumptions are tested, choices compared, and outcomes understood.
A model is only useful if it can answer “what happens if…?” Analysis requires the ability to recast inputs—changing assumptions or data to explore different outcomes without restructuring the model. By adjusting key drivers, bundling parameters into cases, toggling initiatives, or assembling full scenarios, analysts can test how different choices or external conditions shape the institution’s future.

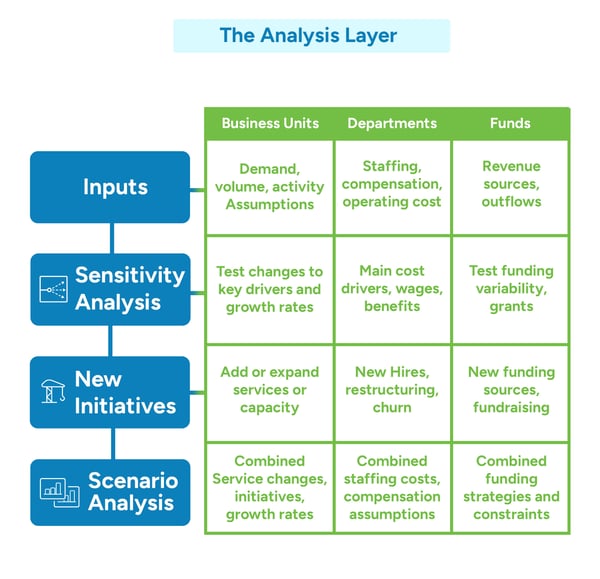
Each of the following strategies offers a distinct way to explore alternatives while preserving the integrity of the underlying model.
Adjusting Inputs
Recasting often begins with adjusting the inputs that drive the model’s behavior. Analysts may revise inputs such as inflation expectations, rate structures, grant renewal timelines, staffing levels, or capital project schedules to reflect emerging conditions or leadership priorities. Even small adjustments in these inputs can meaningfully shift long-term outputs, revealing how sensitive an institution’s financial trajectory is to change.
Recasting inputs shows how individual changes ripple through the model without disrupting the engine.
Cases: Alternative Sets of Parameters
Sometimes analysis requires comparing bundles of assumptions rather than adjusting inputs one at a time. Cases serve this purpose by grouping related parameters into distinct, overwriting core assumptions, making comparisons cleaner and more transparent.
Cases bring structure to what-if analysis, enabling teams to evaluate the trade-offs between multiple strategic paths and understand how different configurations of assumptions shape long-term outcomes.
Modelers often create several alternative sets of assumptions—such as a base case, best case, or worst case—to explore different plausible futures.
By keeping each set separate from the baseline, analysts can switch between perspectives without overwriting their core assumptions, making comparisons clearer and more intentional.
Initiatives: Switchable Add-Ons
While cases represent full sets of alternative conditions, initiatives represent discrete decisions that leadership may choose to implement or defer. Initiatives function like switches—turning a policy, program, or operational change on or off within the model. This allows analysts to test potential actions, understand timing implications, and isolate the financial effect of individual decisions while preserving the broader structure of the model.
Initiatives help connect strategic conversations to specific, quantifiable impacts.
Scenarios: Full Combination of Assumptions, Cases, and Initiatives
A scenario is a complete portfolio that brings together assumptions, cases, and initiatives to represent a fully formed view of a possible future. In practice, financial decisions rarely occur in isolation. Changes in enrollment, rate structures, staffing levels, capital plans, or funding strategies all tend to happen at the same time. Scenarios allow modelers to bring these distinct elements together into a single institutional point of view.
By combining these elements, scenarios allow analysts to compare strategic pathways, mix and match assumption sets, and evaluate how multiple decisions interact over time. They make it possible to see the long-term implications of alternative choices, test the resilience of plans under different conditions, and continually refine the analysis as new information emerges.
Scenarios are the backbone of public-sector decision-making because they clarify trade-offs under uncertainty and give leaders a structured way to weigh competing priorities.
Dimensionality: Viewing the Organization Through Different Lenses
Dimensionality allows analysts to view the model through different lenses, isolating subcomponents of the organization institution without altering the underlying structure. Attributes label business objects so they can be grouped, filtered, and examined based on relevant characteristics such as department, program, asset type, or fund. Parts then aggregate those labeled objects into meaningful subsets, allowing analysts to isolate and understand how individual components contribute to broader financial outcomes. Together, attributes and parts make it possible to examine slices of the model without changing how the engine itself operates.
By enabling selective focus, dimensionality gives decision-makers the ability to examine the institution from multiple perspectives—whether looking at the model by service area, cost center, project type, or funding source. This helps stakeholders explore the model in ways that align with their responsibilities, whether they oversee a program portfolio, a capital plan, a fund, or a department.
Section 3
Present and Communicate the Results
A model has value only when its insights can be understood and used. Communication is where analysis becomes action—where numbers become narrative, and narrative becomes decision-making. In the public sector, where leaders must justify choices transparently and demonstrate stewardship of public resources, clear communication is as essential as the model itself. The following components show how analysis is transformed into a decision-ready story.
Organize Your Financial Story
A strong financial story begins by clarifying the core questions the model is meant to answer. Whether assessing reserve strength across a capital program, evaluating long-term sustainability under shifting demand, or identifying rate paths that balance affordability and infrastructure needs, these questions anchor the analysis and guide interpretation.
The narrative must also match the audience. Finance teams require detailed drivers and variance explanations; executives need visibility into strategic trade-offs; boards and councils must clearly see risks, outcomes, and community impact. Aligning the narrative to each audience ensures comprehension rather than confusion.
Finally, effective communication weaves assumptions, drivers, and outcomes into a coherent storyline. A well-constructed narrative shows where the institution is headed, what forces are shaping that trajectory, what alternatives were tested, and which choices carry the greatest leverage. This narrative clarity builds trust and strengthens decision-making.
Craft Dashboards That Drive Analysis
Dashboards and interfaces transform a model from a technical asset into an accessible decision-support tool. By elevating the assumptions that matter most—growth rates, cost drivers, policy levers, and capital schedules—interfaces give stakeholders visibility into what shapes outcomes.
Interfaces also create structure for exploring alternatives. Users can switch between predefined cases, combine assumptions and initiatives into full scenarios, and test the implications of different strategic choices. Initiatives allow decision-makers to toggle actions on and off and immediately see financial consequences, making the model interactive and accessible.

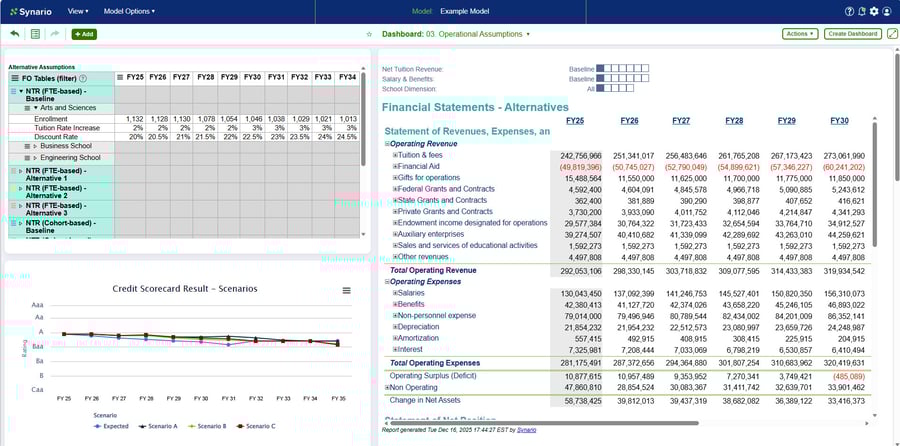
Visualization is equally important. Clear charts, tables, and reports help stakeholders absorb complex information quickly and trace outcomes back to the factors that produced them. While finance teams may be comfortable navigating dense spreadsheets, many board members, council members, and senior leaders are not. Effective visuals translate the model’s narrative into an accessible format—helping decision-makers understand the story behind the numbers.
When outputs are presented clearly and consistently, discussions about trade-offs become more focused, transparent, and grounded in shared understanding
Use the Model to Tell the Story, Guide Decisions, and Move Stakeholders to Action
The purpose of communication is not merely to present outputs—it is to build confidence in the path ahead. The narrative frames the decisions at stake; the interface reveals the alternatives; the model’s outputs illuminate their consequences. When these elements work together, modeling becomes a powerful tool for alignment.
Clear communication enables boards to understand financial pressures and strategic opportunities, allows executives to demonstrate transparent reasoning, and helps community stakeholders see how proposed actions support long-term sustainability. A well-communicated model becomes a catalyst for trust, shared understanding, and organizational consensus—transforming forecasting into strategic credibility.
Learning Objectives Recap
By the end of this module, you should be able to:
Explain how business objects, parameters, relationships, and time-series logic form the core modeling engine and determine how a model behaves over time.
Describe how recasting inputs, cases, initiatives, scenarios, and dimensionality create a structured environment for exploring alternative futures.
Understand how dashboards and interfaces connect users to the model, enabling assumption testing, scenario exploration, and real-time comparison of outcomes.
Recognize how clear narrative structure and audience-aligned communication turn model outputs into actionable, decision-ready insight for public-sector stakeholders.
Quick Quiz
Test Your Knowledge
- A) They automate report formatting for dashboards
- B) They represent real operational components whose behavior can be modeled over time
- C) They store raw imported data before it is organized
- D) They ensure all users share identical viewing permissions
B) They represent real operational components whose behavior can be modeled over time
- A) Updating assumptions about how existing enrollment patterns evolve over time, compared to modeling the financial impact of a new academic program
- B) Updating assumptions about future tuition pricing, compared to updating assumptions about future enrollment behavior
- C) Updating assumptions about compensation growth, compared to adjusting staffing levels within existing departments
- D) Updating assumptions about utility demand, compared to revising historical consumption data
A) Updating assumptions about how existing enrollment patterns evolve over time, compared to modeling the financial impact of a new academic program
- A) It permanently restructures the model to simplify each scenario
- B) It allows analysts to isolate, group, and compare parts of the organization without altering the underlying logic
- C) It automatically eliminates unused business objects, improving performance
- D) It limits the number of assumptions users can modify
B) It allows analysts to isolate, group, and compare parts of the organization without altering the underlying logic
Wrap Up
The Synario Advantage
The concepts in this module describe what modern financial modeling requires: a structured engine, flexible analytical tools, and clear communication. Synario brings these elements together in a single environment designed for the way public-sector institutions plan, collaborate, and make decisions.
A stronger modeling engine.
Synario’s object-based structure mirrors real-world operational components—programs, funds, departments, assets—making assumptions, relationships, and time-series behavior easier to build, understand, and maintain over time. This keeps the engine consistent even as leadership, policies, or priorities change.
More rigorous and adaptable analysis.
Cases, initiatives, and scenarios are built directly into Synario, allowing analysts to explore alternatives without cloning files or restructuring logic. Users can test individual decisions or full strategic futures with clarity, making “what happens if…?” analysis fast, transparent, and repeatable.
Clearer communication and stakeholder alignment.
Dashboards in Synario connect directly to the modeling engine, allowing stakeholders to adjust assumptions, compare scenarios, and visualize outcomes instantly. This real-time interaction helps leaders understand trade-offs, evaluate timing, and build consensus with confidence.
By uniting structure, analysis, and communication, Synario turns modeling into a reliable decision framework—supporting clarity, foresight, and shared confidence across public-sector institutions.
More Courses to Come
Congratulations on your progress! Stay tuned for more...