
Section 1
Why Timing Matters in Public-Sector & Higher Ed Models
Every financial model depends on time. In Higher Ed, enrollment cycles, academic terms, and tuition windows create predictable patterns, but cash flow timing varies across the year. Utilities face seasonal consumption patterns, multiyear capital programs, and regulatory planning cycles. Government entities often budget annually but plan decades into the future for infrastructure, workforce, or pension needs.
These realities make timing more than a formatting decision. It is a structural choice that shapes how financial activity is represented and interpreted. The cadence of time in a model determines whether patterns are visible or obscured, whether volatility is smoothed or exposed, and whether near-term operations and long-term strategy can be evaluated within the same analytical framework.
The timing structure of a model, its periodicity and its time horizon, determines how well it can represent these realities. Set them thoughtfully, and a model becomes a clear map of institutional direction. Set them poorly, and even sound assumptions can produce misleading results, masking risk or overstating stability.
Section 2
Traditional Approach to Periodicity
Establishing a Base Periodicity
Modelers begin by selecting a base periodicity, most often monthly, quarterly, or annual, and the entire model is shaped around that choice. The decision typically reflects operational needs:
MONTHLY
-
Utility consumption forecasts
-
Operating budgets
-
Payroll cycles in Municipal and Higher Ed operations
QUARTERLY
-
Board of Trustees reporting
-
Grant reimbursement cycles
-
Transit district ridership and fare revenue summaries
ANNUALLY
-
Program-level or enrollment-driven revenue planning
-
Funding requirements
-
Multi-year rate modeling for utilities
Once the base period is set, every formula, reference, and report in the model becomes tied to that time structure. Problems emerge when different audiences need the same information presented through different temporal lenses. Finance and accounting teams may need monthly cash details, governing boards tend to prefer quarterly summaries, and long-range planning committees orient themselves around annual projections.
To meet these varied needs, modelers often must reshape the same data into alternative reporting views, such as:
- Monthly → Quarterly & Annual roll-ups
- Quarterly → Annual roll-ups
- Annual → Long Range Multi-Period Analysis
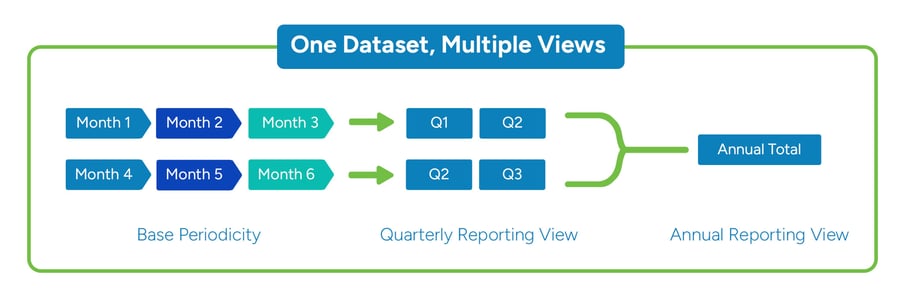
In traditional modeling, accommodating these alternative reporting views typically requires additional layers of manual construction. Modelers often rely on accordion-style formulas that carefully sum or redistribute blocks of periods to move between monthly, quarterly, and annual perspectives, or they create duplicated reporting structures that are manually re-aggregated at the desired timeframe. As these layers accumulate, the model becomes more complex to manage, harder to audit, and increasingly burdensome to maintain.
Handling Different Types of Financial Line Items
Different financial values behave differently across time, and a model’s periodicity must account for those distinctions. Some values are duration-based, meaning they accumulate over the course of a period. Revenues and expenses fall into this category: they represent activity that happens throughout the month or quarter. Each month contributes to the overall figure, so the model must sum up the underlying periods to reflect the true financial picture.
Other values are instant values, which represent a snapshot at a specific point in time. Balances, counts, and status indicators fall into this category. A water utility’s debt outstanding, for instance, should reflect the ending balance of the final month in the quarter—not the sum of all three months. The correct quarterly value is the moment-in-time figure, not the accumulated activity leading to it.
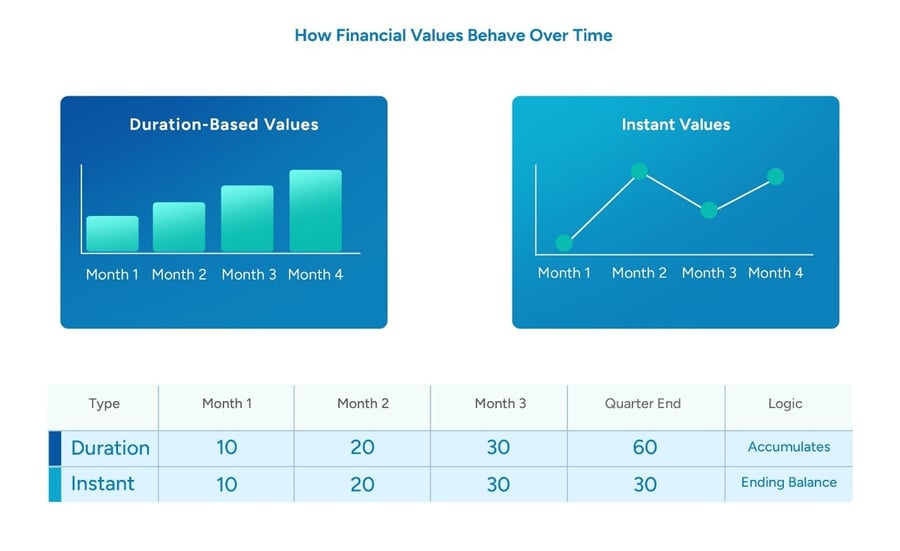
Because duration-based and instant values follow fundamentally different rules, modelers must embed and maintain separate logic for each. As reporting needs expand across departments, funds, or program areas, these parallel logic paths increase the likelihood of inconsistency and error. A model that handles these categories incorrectly may misstate balances, distort trends, or fail to align with reporting standards, all of which undermine confidence in the results.
Operational Challenges of Managing Time Manually
The traditional approach to managing periodicity introduces a series of risks that tend to compound over time. Much of the work becomes highly manual and repetitive. Finance teams often find themselves rebuilding roll-ups and accordion formulas for every quarterly board packet or cyclical reporting requirement. These recurring tasks demand significant time, especially when annual summaries must be reconstructed for accreditation reviews, regulatory filings, or rate-case analyses.
As reporting layers multiply, so does the complexity of the model. Each new view: monthly, quarterly, annual, adds another set of dependencies that must remain synchronized across worksheets and departments. This layered structure increases the likelihood of formula errors; even something as small as a mis-indexed period can distort an institution’s forecasts
Underlying these challenges is a structural fragility. Because time logic is embedded throughout the model, even modest changes, like adding a new month, revising an academic term, or shifting a fiscal-year boundary, can break references and calculations elsewhere. In public-sector environments, where transparency, auditability, and multi-period reporting are essential expectations, these risks accumulate quickly and can undermine confidence in the model’s reliability.
Section 3
Time Horizon: How Far the Model Looks Into the Future
The time horizon determines how many future periods the model projects: 5, 10, 20, or even 30 years. In public-sector planning, horizons must support long asset lives, changing demographics, and multi-year funding cycles.
Establishing the Original Horizon
Modelers define the initial length of the model based on planning needs:
- A university might model 5–10 years of enrollment and tuition impacts
- A city may project 6–10 years of operating budgets for council planning
- A utility might forecast 20–30 years for infrastructure renewal and rate-setting
- A transit authority may plan a decade ahead for fleet replacement or ridership recovery
Once set, every formula, reference, name range, and output anchors to this structure.
Extending the horizon later becomes difficult because the entire model is built around the original time frame.
Appending Additional Periods Over Time
As conditions change, planning horizons almost always need to expand. New capital projects may require projections that extend decades into the future, while labor negotiations introduce revised salary and benefit trajectories that must be reflected across multiple years. Bond refinancing can lengthen debt schedules, enrollment shifts may force institutions to examine longer-term enrollment and revenue impacts, and utility asset condition assessments often alter replacement timelines well beyond the original planning window.
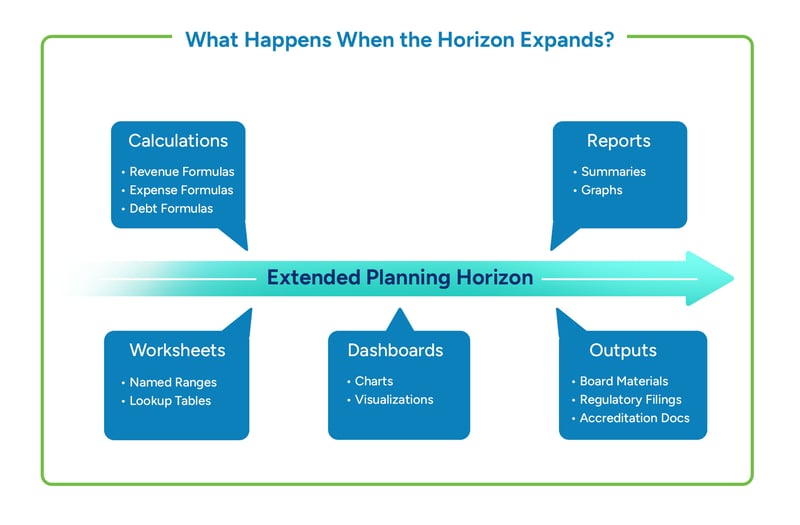
In traditional models, extending the horizon typically triggers a cascade of structural work. Additional columns must be added across worksheets, formulas for revenues, expenses, debt, and capital must be copied forward, and named ranges, lookup tables, and references need to be updated to accommodate the new periods.
Charts and visualizations must also be expanded to reflect the longer timeframe, and downstream outputs, such as board materials, council presentations, accreditation documentation, or regulatory filings, often need to be regenerated. Because every part of the model is tied to the same time structure, each extension must occur in lockstep to preserve consistency and analytical integrity.
Challenges of Managing Long Horizons Manually
Managing long-term horizons using traditional methods introduces increasing complexity as models evolve. Extending the horizon requires modifying formulas tied to older time ranges, updating named references used across different parts of the model, adjusting year-indexing logic, and reworking dashboards and summary outputs. Because these elements are tightly interconnected, a single overlooked reference can compromise the reliability of downstream results.
The work is also highly repetitive. Every major section of the model: operating budgets, capital planning, tuition modeling, debt service, utility consumption, and even pension obligations, must be updated manually to reflect the expanded horizon. This can require touching dozens of worksheets, significantly increasing time investment and error risk. Inconsistent updates across departments or funds can create misalignment in reporting, particularly in public-sector environments where long-range planning is mandatory and comparability across years is essential.
These challenges become even more pronounced in sectors where long-term planning is not optional. Municipal governments are often required to prepare multi-year expenditure forecasts to support budgeting, labor negotiations, and capital planning. In this context, the ability to extend and maintain a reliable planning horizon is essential to sound decision-making.
Course Section 4
How Periodicity and Horizon Work Together
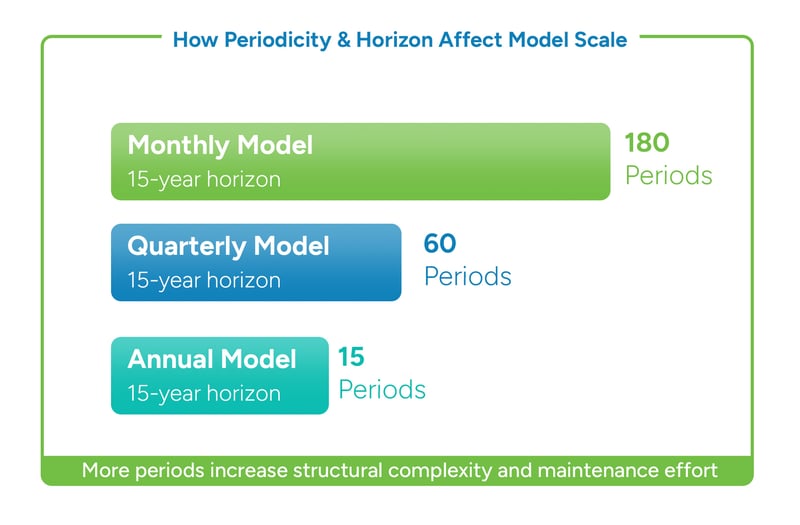
Periodicity and horizon intersect to shape the overall scale and purpose of a financial model. A monthly model with a ten-year horizon, for example, contains 120 periods. This structure provides detailed operational visibility and works well for near-term cash flow analysis, but it can become heavy and difficult to manage for long-range strategic planning—placing it firmly in what might be considered an operational detail zone.
At the other end of the spectrum, an annual model spanning thirty years is often well suited for debt planning, capital forecasting, and long-term tuition or rate analysis. This approach supports high-level direction and sustainability assessment, aligning more closely with a strategic planning zone where clarity over time matters more than granular precision.
In fact, annual models are the most common structure across Higher Ed and public-sector finance. Boards and governing bodies typically review results on a fiscal-year basis, bond capacity analyses are framed annually, capital plans are evaluated over multi-year increments, and long-range financial forecasts often extend 10, 20, or even 30 years. Annual periodicity provides a manageable framework for evaluating operating balance trends, debt sustainability, infrastructure investment capacity, and long-term solvency without overwhelming the model with structural complexity.
This cadence also aligns naturally with strategic planning cycles. When institutions assess affordability of new programs, capital expansions, rate adjustments, or workforce growth, the questions are typically framed in annual impact and multi-year sustainability. An annual model provides sufficient clarity to evaluate trajectory and stress points while keeping the structure intuitive for leadership.
Across these contexts, the goal is balance: enough detail to inform decisions without overwhelming the analysis. When time structures are set deliberately, a model can function both as a near-term operational guide and a long-term planning tool, revealing patterns, stress points, and the trajectory of institutional sustainability.
Learning Objectives Recap
After completing this introduction, you should be able to:

Explain how periodicity and time horizon influence the behavior and usefulness of a financial model
Identify how duration-based and instant financial values interact with different time structures
Choose an appropriate periodicity and horizon based on institutional needs and decision-making contexts